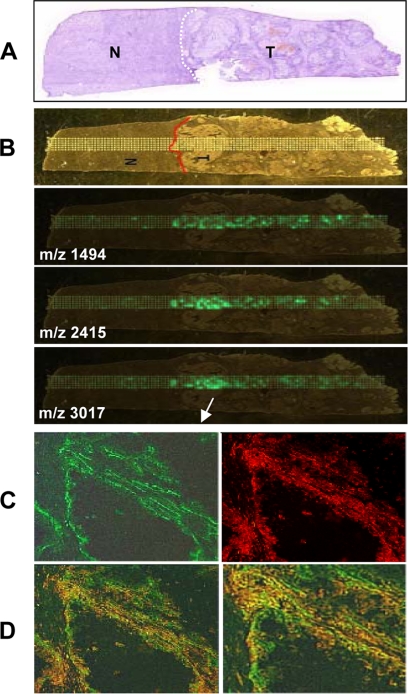
FIGURE 6.
Mass spectral identification of CYP2C9 as a tumor-expressed human epoxygenase. A and B, frozen serial sections of a human clear renal cell carcinoma were stained with either hematoxylin & eosin for evaluation of tumor-free (N) and tumor-containing (T) areas (A) or co-stained with anti-human CYP2C9 (red) and anti-human CD31 (green) to visualize the localization of CYP2C9 (C). D, overlay images show the expression of CYP2C9 epoxygenase in the tumor-associated vasculature. B, trypsin-digested serial sections of the human cell carcinoma shown in A were analyzed by mass spectral imaging at m/z 1491, 2415, and 3017, diagnostic for CYP2C9. Laser sampling was done using the dot matrix shown superimposed to a light microscopy image of the sections. CYP2C9-positive regions are identified by co-localization of mass signals derived from the CYP2C9 diagnostic peptides shown in green.

