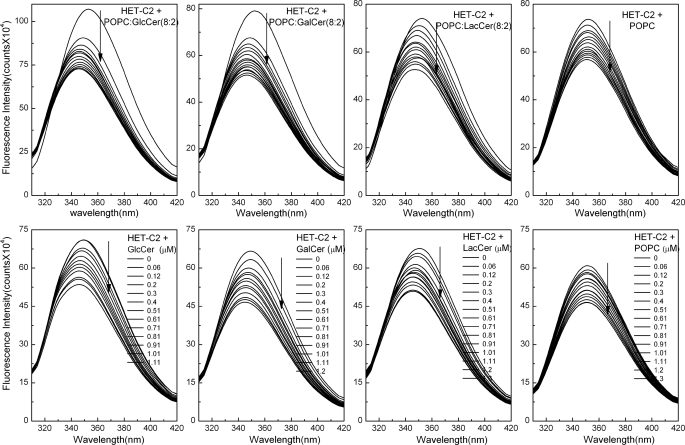
FIGURE 6.
Changes in HET-C2 Trp emission induced by lipids. Top, POPC vesicles containing or lacking glycolipid were introduced in stepwise fashion with 5-min incubation times between injections. The vertical arrows indicate increasing vesicle concentration. The first few injections of membrane vesicles containing GalCer or GlcCer (∼1.2 μm total available glycolipid by the third injection) induce a strong intensity decrease and λmax blue shift. Additional injections result in Trp emission intensity decreases of similar magnitude to those observed with POPC vesicles lacking glycolipid. The λmax blue shift occurred only when the vesicles contained glycolipid. Bottom, stepwise microinjection of lipids, dissolved in ethanol, was used to mix lipids with HET-C2 with 5 min incubation times between injections. The vertical arrows indicate increasing lipid concentration. The starting glycolipid injection and each incremental addition corresponded to ∼10-fold lower levels than with the vesicle additions (top). Fluorescence measurements were performed as described under “Experimental Procedures.” Control injections enabled correction for dilution effects.

