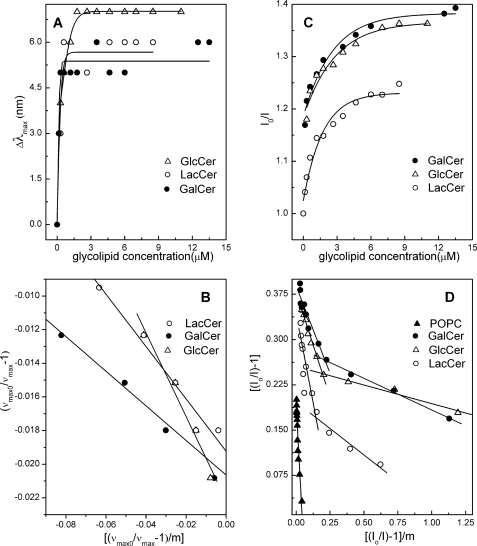
FIGURE 7.
HET-C2 binding analyses for different glycolipids presented as membrane vesicles containing or lacking glycolipid. A, blue shift in Trp emission wavelength maximum (Δλmax) of HET-C2 induced by POPC vesicles containing different glycolipids. B, analyses of Δλmax blue shift data expressed as wavenumber (ν). C, intensity (I) change in Trp emission of HET-C2 induced by POPC vesicles containing different glycolipids. D, analyses of intensity change data. Subscript 0 indicates values in the absence of added vesicles. Calculations utilized the approach of Bashford et al. (47) and were performed as described under “Experimental Procedures.”

