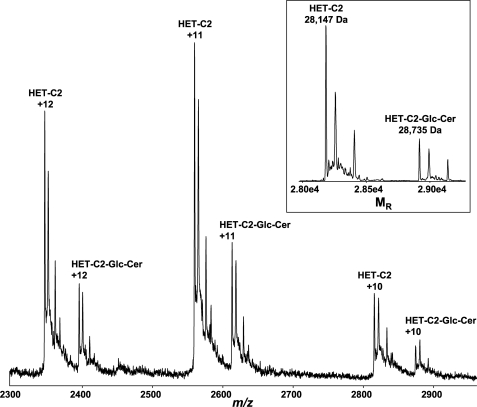
FIGURE 8.
Electrospray ionization mass spectrometry analysis of HET-C2-glycolipid complex. Three main charge states are observed from the direct infusion of the HET-C2:N-octanoyl GlcCer complex (2:1 molar ratio) under nondenaturing conditions. The transformed spectra (see inset) result in molecular masses of 28,147 Da for rHET-C2 and 28,735 Da for the rHET-C2-N-octanoyl GlcCer complex. The N-terminal His6-S tag accounted for the molecular mass being higher than wild type HET-C2 (23,179 Da).

