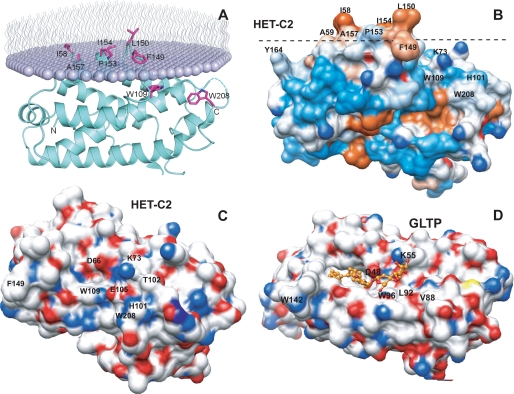
FIGURE 9.
Surface topography of predicted membrane docking site of HET-C2 and sugar headgroup recognition site of HET-C2 and GLTP. A, HET-C2 orientation and positioning during membrane docking. The OPM computational approach (57) was used to identify residues involved in the initial docking of HET-C2 with the membrane interface. The lipid molecules comprising half of the membrane are shown as lavender-colored with wavy lines representing the lipid hydrocarbon chains. HET-C2 helices are cyan-colored, and important side chain residues are shown in magenta. B, surface hydrophobicity of HET-C2 (Protein Data Bank code 3KV0). Mapping was performed using Chimera (58, 59), which relies on the Kyte-Doolittle scale to rank amino acid hydrophobicity, with blue indicating most hydrophilic, white equaling 0.0, and orange-red being most hydrophobic. The dotted black line corresponds to the membrane interface oriented as shown in A. C, surface topology of the GSL sugar headgroup binding site of HET-C2. Surface residue color reflects charge status (red, negative; blue, positive; white, neutral). To provide spatial relationships reflecting the situation in wild type HET-C2, the exogenous dimethyl group added to Lys73 to facilitate HET-C2 crystallization is not shown. Glu105, Thr102, and His101 obstruct the surface adjacent to Trp109. D, surface topology of the GSL sugar headgroup binding site of human GLTP. Surface residue color reflects charge status (red, negative; blue, positive; white, neutral) for the GLTP-18:1 LacCer complex (Protein Data Bank code 1SX6) (9). 18:1 LacCer is depicted in gold with the hydrocarbon chains of ceramide (left) disappearing into the hydrophobic tunnel. The open, unobstructed surface adjacent to Trp96 allows for broader selectivity for binding of various glycolipids.

