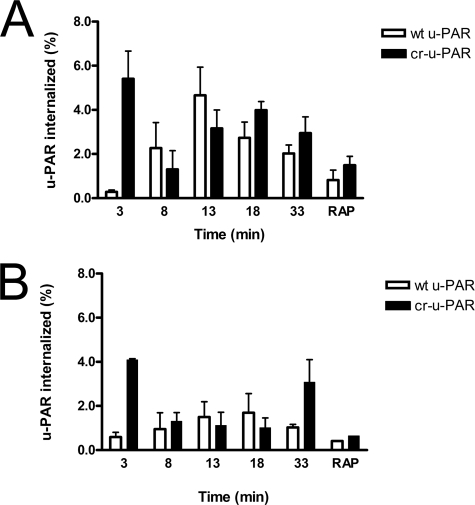
FIGURE 3.
cr-u-PAR is internalized rapidly compared with wt u-PAR. Cells expressing wt u-PAR (white bars) and cr-u-PAR (black bars) were briefly surface-labeled with reducible biotin and incubated with 10 nm tcu-PA·PAI-1 complex (A) or buffer (B) at 4 °C. Internalization was initiated by exposure to 37 °C and terminated via cell-surface reduction with dithiothreitol and cell lysis, with time points representing the duration of incubation at 37 °C plus the dithiothreitol exposure. 500 nm RAP was added to the control reaction with every new incubation. Internalized non-reduced u-PAR was isolated and detected as described. Total u-PAR was detected by subjecting 20 μl of total cell lysate to SDS-PAGE and immunoblotting. Data represent the amount of non-reduced u-PAR (internalized) as a percentage of total u-PAR in each sample, and shown are the means ± S.E. of at least three independent replicates.

