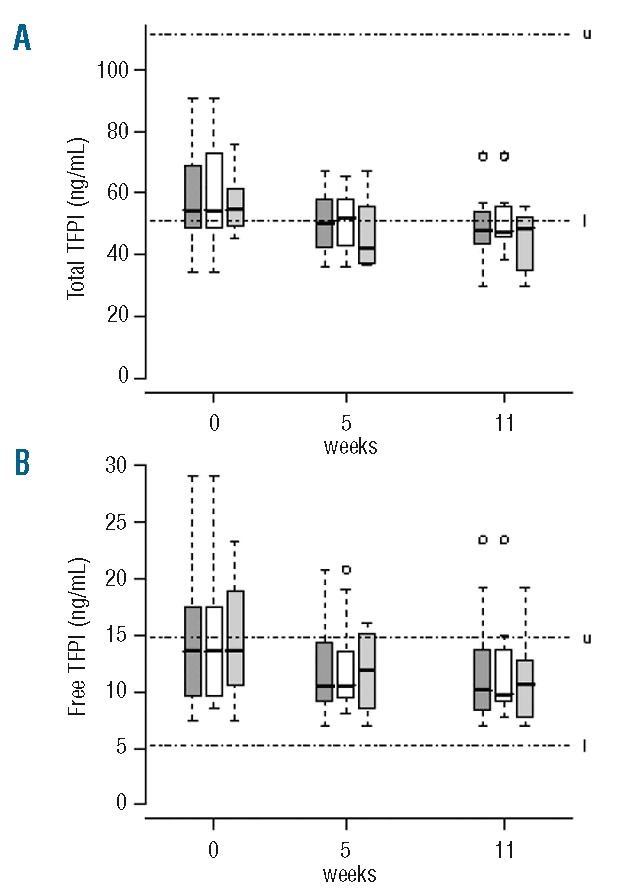
Figure 3.

Distribution of total TFPI (A) and free TFPI (B) antigen plasma levels in the whole cohort ( ), and in patients without (□) and with anticoagulant therapy (
 ) at baseline, and at week 5 and week 11 of eculizumab treatment. Boxes and whisker plots represent the median (full line) and the 25th and 75th percentiles (boxes), and the outer whiskers extend to the most extreme data point, which is no more than 1.5 times the interquartile range from the box. Upper and lower limits of normal are indicated, by u and l, respectively.
