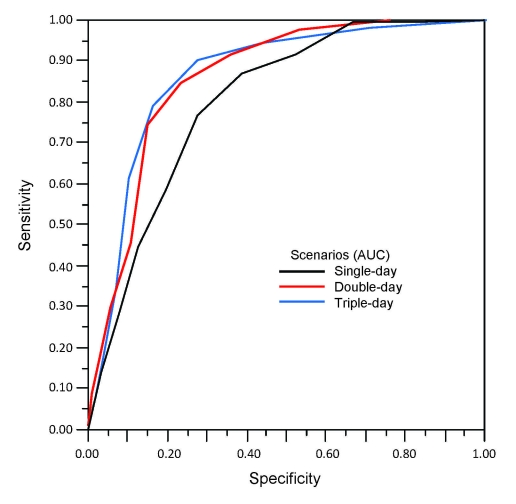
Figure 2.
The receiver operating characteristic (ROC) curve for detection of influenza outbreak by 1%–9% thresholds under single-day, double-day, triple-day scenarios. ROC space is defined on the x axis as 1 – specificity and on the y axis as sensitivity. The area under the curve (AUC) is an indicator of the quality of a model; larger AUC values corresponded to better performance. Optimal thresholds for the 3 scenarios are *single-day, 5%; †double-day, 4%; and ‡triple-day, 3%.

