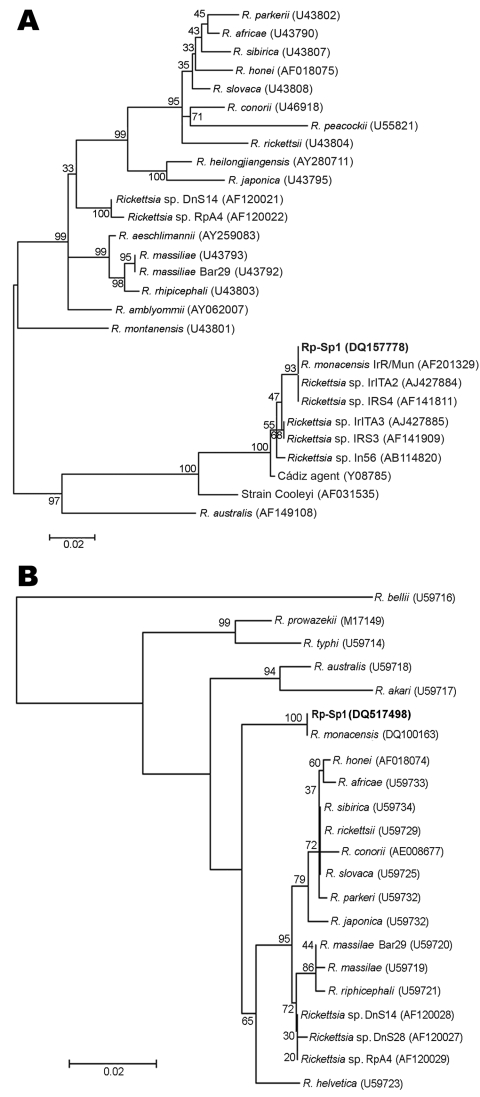
Figure.
Neighbor-joining phylogenetic analysis based on ompA (panel A) and gltA (panel B). Mega 3 software (www.megasoftware.net) was used for the calculation of pairwise distances. Numbers near each node represent the bootstrap values. The isolate from patient 1 is shown in boldface. GenBank accession no. for each sequence is in parentheses.

