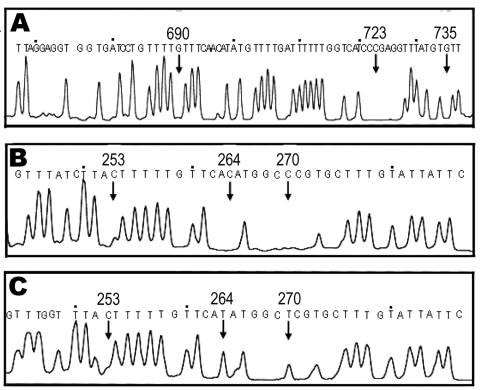
Figure 2.
Molecular identification of formalin-fixed and acetocarmine-stained samples by base excision sequence scanning thymine-base (BESS) T-base analysis. BESS T-base profiles are shown in panels A, B, and C. A) Thymine-base profile using the 112-bp cox1 products from patient samples 3–6. B) and C) BESS T-base analysis data that used 136-bp cob products from scolices with and without hooklets, respectively. Arrows indicate diagnostic positions. Nucleotide sequences indicated above the peaks are from GenBank databases (AB066485 for cox1, AB066570 and AB066580 for cob).

