
Figure 4. Expression of autophagy markers by prostatic acini.
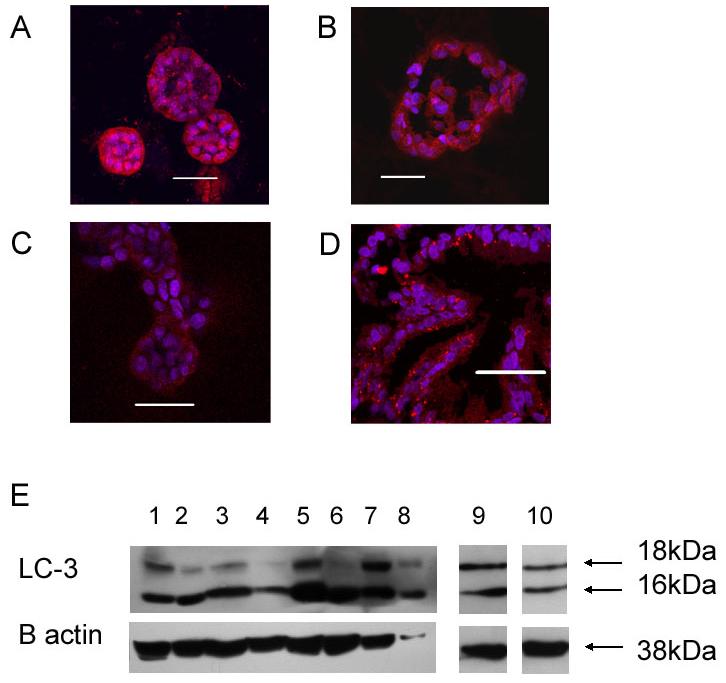
A-D. Immunohistochemical expression of LC-3 in cell lines (A, RWPE-1; C, BPH-1) grown in Matrigel for 7 days, primary cultures grown for 14 days (B) or normal prostate tissue (D). Acini were fixed and stained for LC-3 (red) and nuclei were counterstained with DAPI. Representative images are shown that cross-section through the middle of acini. All bars indicate 50 μm.
E. Acini prepared as described above were immunoblotted for LC-3. Lanes are as follows: 1, BPH-1 grown in monolayer culture; 2, BPH-1 grown in 3D Matrigel; 3, Shmac 5, in monolayer; 4, Shmac 5 in 3D; 5, RWPE-1 in monolayer; 6, RWPE-1 in 3D; 7, PC-3 in monolayer; 8, PC-3 in 3D; 9, Hela in monolayer; 10, primary prostate cells (patient D). ß actin was used to indicate protein loading.