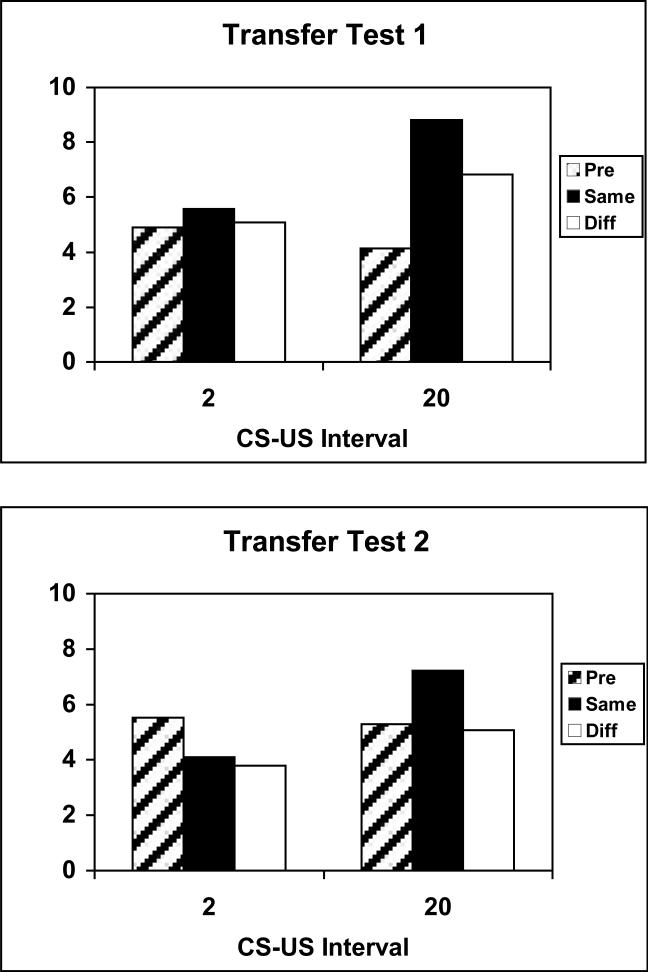
Figure 13.
Data from the PIT tests of Experiment 4 for groups trained with 20-s or 2-s CS-US intervals. Mean instrumental responses (+/- standard error) are shown separately during the pre stimulus period, and during the stimuli according to whether the stimulus and response were reinforced previously with the same or different US. Panel A shows data from the test sessions in which the stimuli were tested at their training durations in each group. Panel B shows data from the second set of test sessions in which the stimuli were tested at the other groups training durations.

