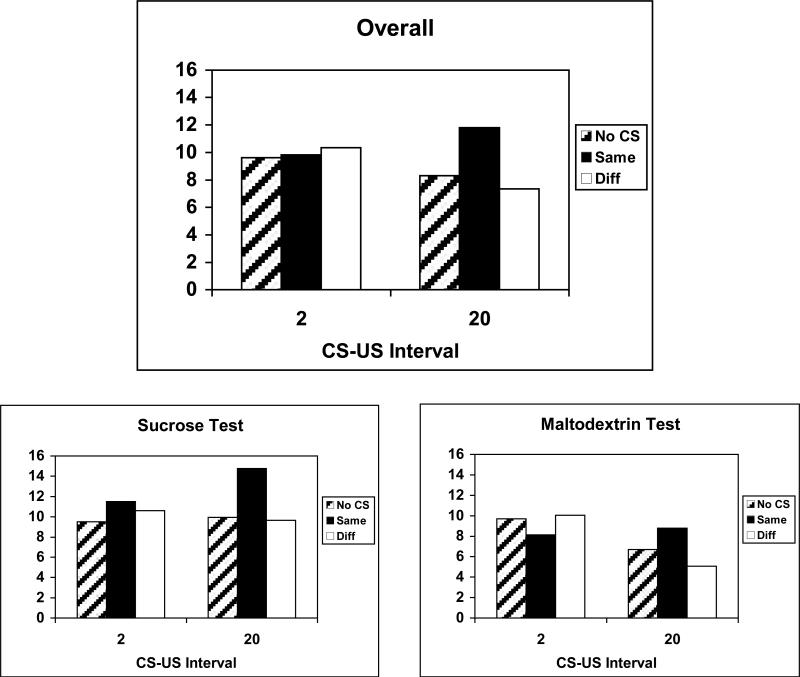
Figure 14.
Data from the potentiated feeding tests in Experiment 4, shown separately for the groups trained with 20-s or 2-s CS-US intervals. Mean number of US deliveries (+/- standard error) is shown for the test sessions in which no CS was presented and in sessions in which the CS signaled the same or different US than was actually delivered. Data are shown collapsed across US identity, as well as for each US (sucrose or maltodextrin).

