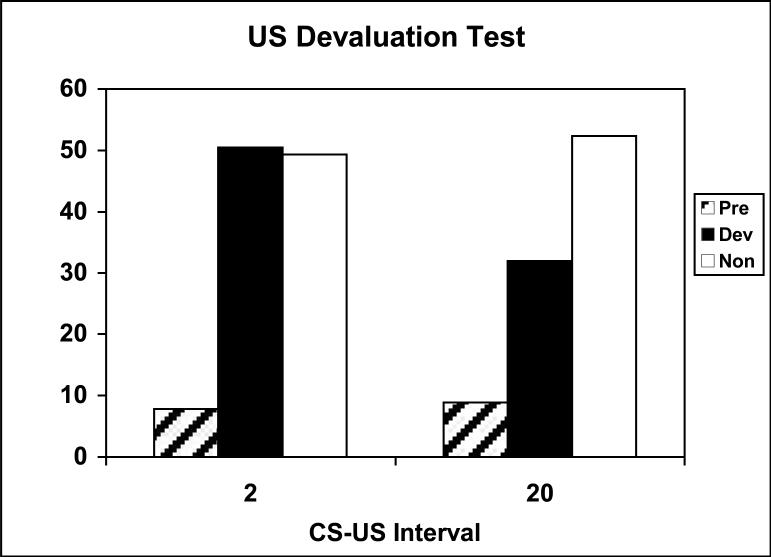
Figure 15.
Results from the US devaluation test in Experiment 4, shown separately for groups trained with 20-s or 2-s CS-US intervals. Mean % time in food cup (+/- standard error) is shown during pre stimulus and stimulus periods when the associated US was devalued or non-devalued (see Methods for details).

