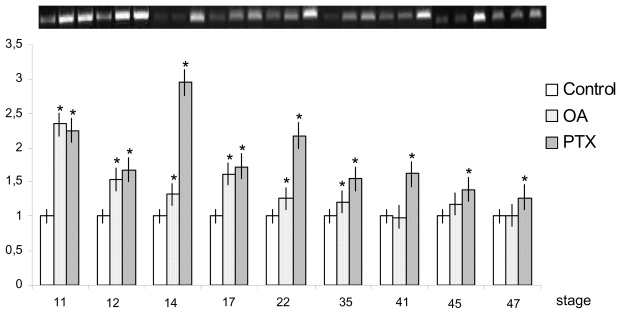
Figure 12.
myf5 expression levels in X. laevis embryonic and early larval stages after toxin treatments. Bars represent SD from the mean value of light intensity registered for each sample and normalized versus control value (*p < 0.05). (Reprinted with permission from [82]).

