
Figure 2.
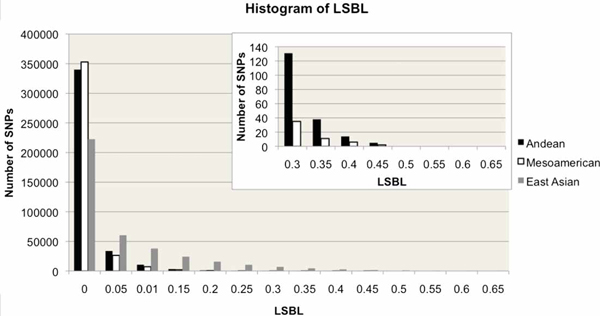
Empirical distribution of LSBL across three populations: Andeans, Mesoamericans and East Asians. The inset shows LSBLs above 0.3 for Andeans and Mesoamericans. These two populations have fewer LSBLs above 0.15 compared with the East Asians, which is expected, given their more recent common ancestry. LSBL = Locus-specific branch length.