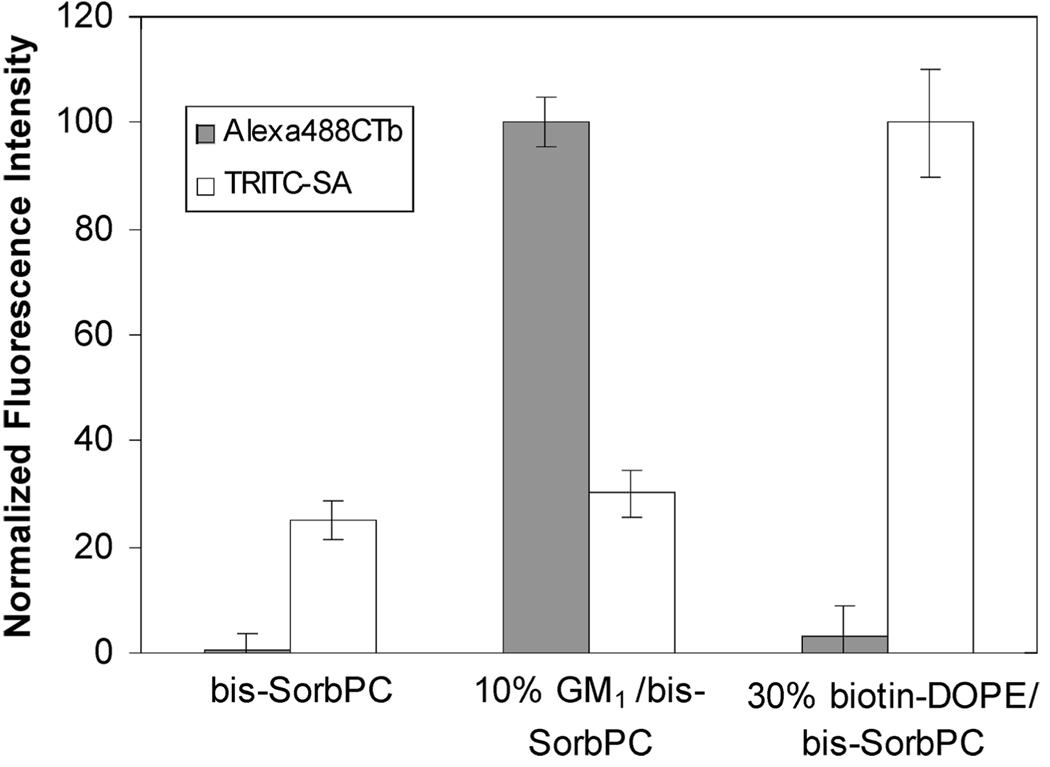
FIGURE 3.
Plot of normalized average fluorescence intensities of Alexa488CTb and TRITC-SA adsorbed from a mixture of the two proteins to a lipid microarray consisting of 30% biotin-DOPE in poly(bis-SorbPC), 10% GM1 in poly(bis-SorbPC), and pure poly(bis-SorbPC). The error bars represent the standard deviations of six trials.

