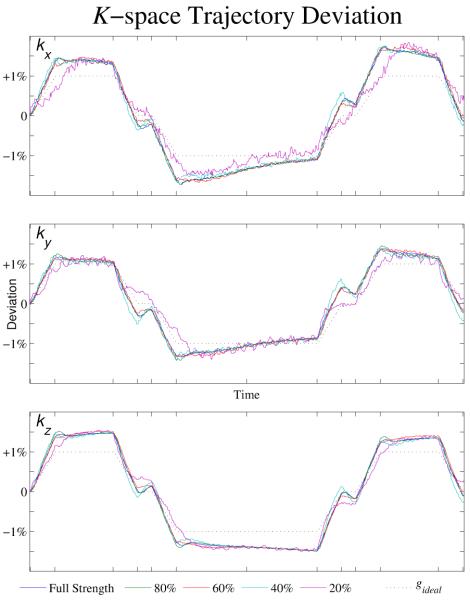
Figure 8.
K-space trajectory deviations appear to vary approximately linearly with gradient amplitude, as shown here by subtracting nominal waveforms from the measured waveform for several gradient amplitudes. The k-space trajectory deviation is showed as a percentage deviation from the desired trajectory for several gradient amplitudes. As the deviation waveforms have a shape that is similar to the gradient waveform (black dotted line), it is apparent that they the deviations are predominantly due to a gradient delay rather than eddy currents.

