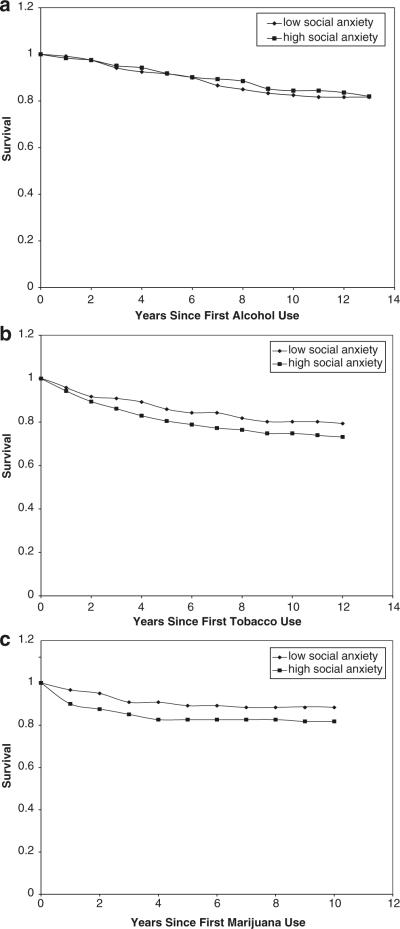
Fig. 4.
(a) Survival plots for high (75th percentile) and low (25th percentile) levels of social anxiety, depicting time from first use to first alcohol-related problem; (b) Survival plots for high (75th percentile) and low (25th percentile) levels of social anxiety, depicting age time from first use to first tobacco-related problem; (c) Survival plots for high (75th percentile) and low (25th percentile) levels of social anxiety, depicting time from first use to first marijuana-related problem

