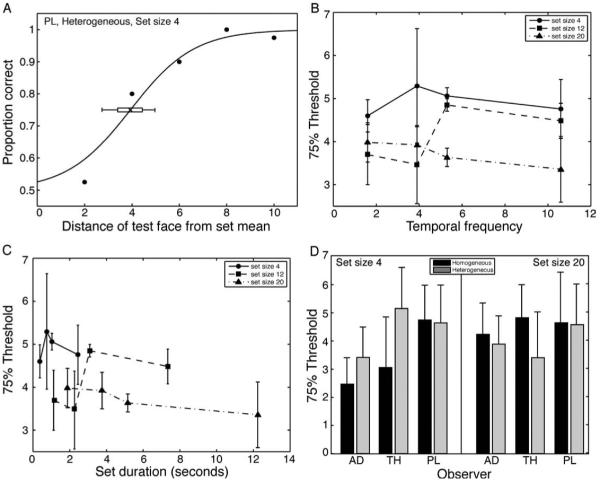
Figure 4.
Experiment 1A results. (A) Representative psychometric function. For each observer and condition, 75% thresholds were derived. The threshold averaged across observers is depicted in (B), plotted as a function of temporal frequency. (C) 75% thresholds replotted as a function of overall set duration. (D) Results of the control experiment, showing 75% thresholds on homogeneous (identical faces) and heterogeneous sets of faces for each observer. Performance did not differ between the two tasks for either set size 4 or 20. Error bars in (A) are 95% confidence intervals derived from bootstrapping 5000 curve fitting simulations. Error bars in (B-D) represent ± one standard error of the mean (SEM).

