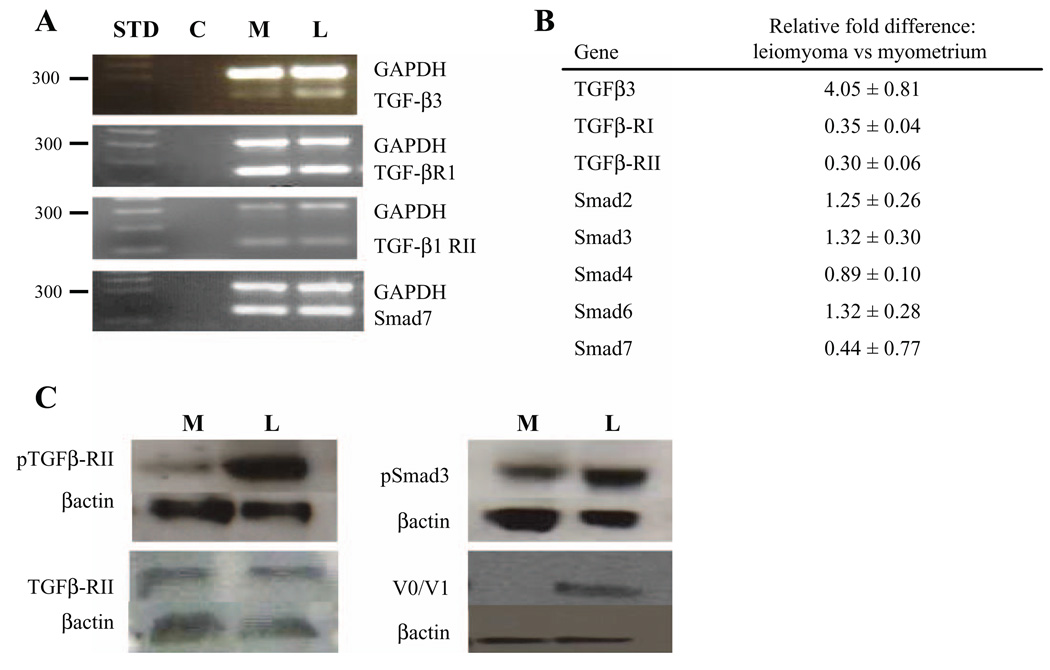
Figure 2.
Expression of transforming growth factor β (TGF-β) ligands, TGF-β receptors, and Smad second messenger system. A, Semiquantitative reverse transcriptase–polymerase chain reaction (RT-PCR) expression for TGF-β3, TGF-β RI, TGF-β1 RII, and Smad 7. Lane 1 = molecular size standard (STD; 300 base pair marker listed), lane 2 = no template control (C), lane 3 = myometrial tissue transcript gene expression (M), and lane 4 = leiomyoma tissue transcript gene expression (L). B, Relative fold expression differences in leiomyoma versus myometrial tissue by real-time quantitative RT-PCR for the following genes: TGF-β3 (P≤.01), TGF-β RI (P≤.001), TGF-β RII (P≤.001), Smad 2 (NS), Smad 3 (NS), Smad 4 (NS), Smad 6 (NS), and Smad 7 (P = .042). C, Representative Western blot analysis demonstrating overexpression of both phosphorylated TGF-β RII and phosphorylated Smad 3 with largely unchanged expression of unphosphorylated TGF-β-RII.

