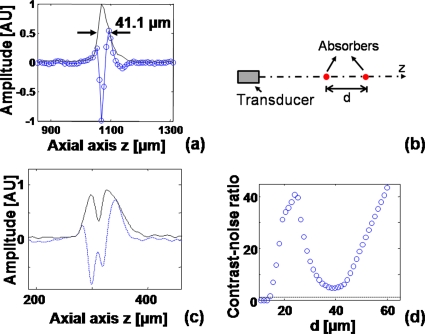
Figure 3.
Axial resolution of the 2-μm PAM system. (a) Axial spread profile of a typical nanocage. Blue line with circle: experimental measurement. Black solid line: envelope of the experimental data. (b) Configuration of numerical shift-and-sum experiment. (c) Simulated photoacoustic signal and envelope when d=20 μm. Blue dashed line: photoacoustic signal. Black solid line: envelope of the signal. (d) CNR versus d. Blue circles: calculated CNR. Black dashed line: CNR=1. (Color online only.)

