Figure 5.
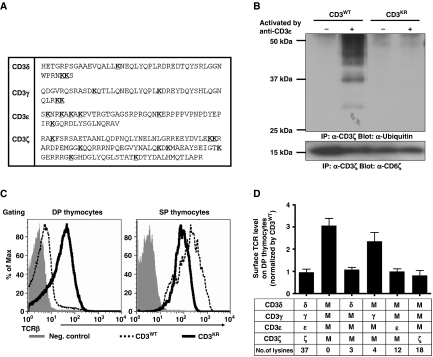
Regulation of TCR surface expression by CD3 tonic ubiquitylation. (A) The amino-acid sequence of the CD3 cytoplasmic domains highlighting the 37 lysine residues (bold and underlined). (B) Retrogenic mice were generated by transducing CD3ɛζ−/− bone marrow with CD3WT or CD3KR constructs as indicated, transplanting into sublethally irradiated Rag1−/− recipients and analysing 5–8 weeks after transfer. Splenic T cells were purified by MACS from either CD3WT or CD3KR retrogenic mice and activated by CD3ɛ mAb. Lysates were immunoprecipitated with CD3ζ mAb, separated by SDS–PAGE, and western blots were probed with ubiquitin mAb as in Figure 1A. The membrane was stripped and re-probed with CD3ζ mAb to show comparable CD3ζ loading. (C) Representative flow cytometry histograms are presented showing surface TCRβ expression on DP and SP thymocytes from CD3WT and CD3KR retrogenic mice (representative of 10–20 mice from more than three experiments). (D) Surface TCRβ expression on DP thymocytes of CD3WT or various CD3KR retrogenic mice, determined by flow cytometry. The difference between CD3WT and CD3δɛζKRγWT is statistically significant (P=0.008). Data represent the mean±s.e.m. of 5–20 mice from more than two experiments. A full-colour version of this figure is available at The EMBO Journal Online.

