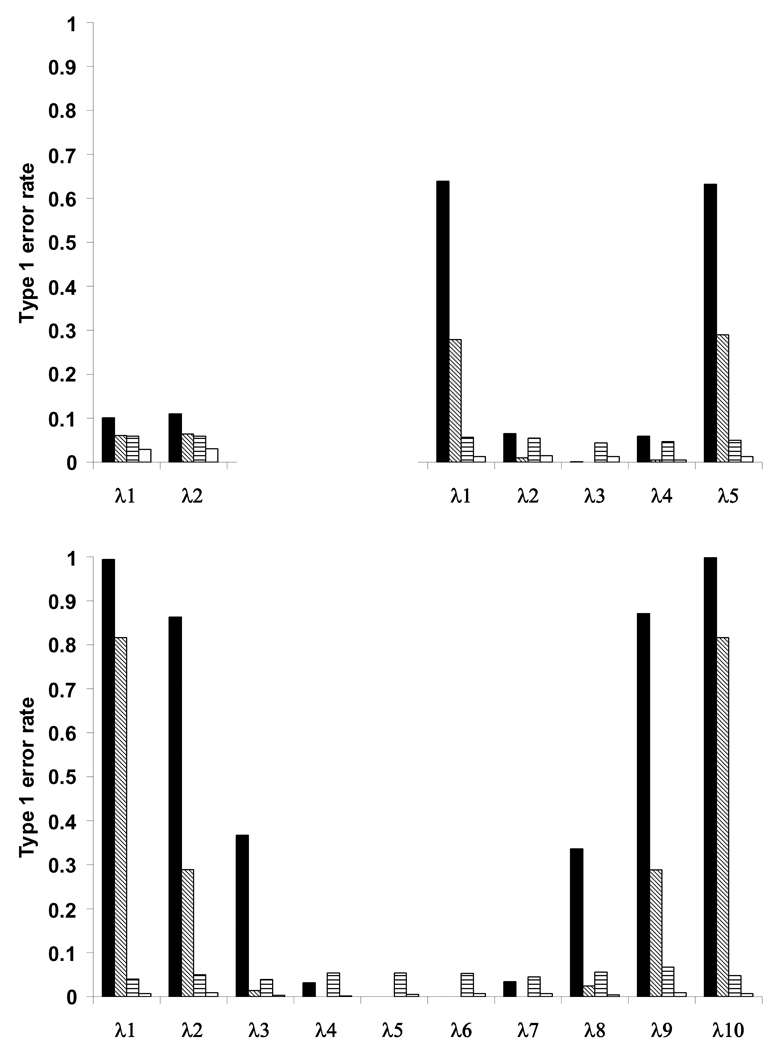
Figure 2.
Type 1 error rates for testing the eigenvalues from a canonical analysis under the null hypothesis of no linear or non-linear effects on fitness for p = two, five and ten traits. Solid black and diagonal bars refer to the Type I error rates using the double regression approach corresponding to an α level of 0.05 and nominally adjusted α of 0.05/ p, respectively. Horizontal and open bars refer to tests of the eigenvalues using the permutation procedure at the unadjusted α level of 0.05 and nominally adjusted α of 0.05/ p, respectively.

