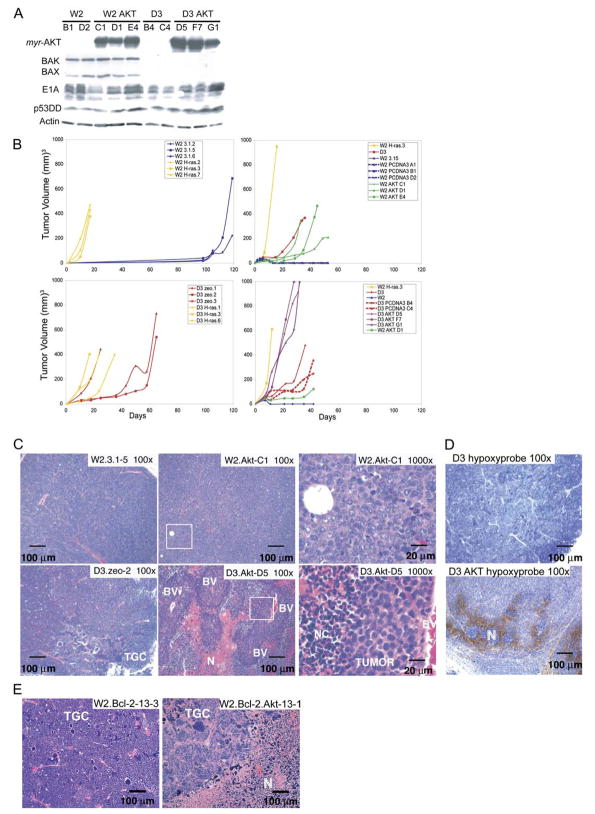
Figure 1. AKT and RAS promote tumor growth in both wild-type and apoptosis-defective genetic backgrounds.
A: Western blots showing protein expression in the W2 and D3 derived vector control and AKT-expressing iBMK cell lines.
B: Tumor growth kinetics of iBMK cell lines. W2 vector controls (blue) compared to W2 derivatives expressing RAS (yellow). W2 vector control (blue) compared to W2 derivatives expressing myr-AKT (green). BAX/BAK-deficient D3 (red) and W2 plus RAS (yellow) are included for comparison. Addition of RAS to BAX/BAK-deficient D3 cells accelerates tumor growth as depicted by D3 (red) and D3 plus RAS (yellow). AKT promotes tumor growth of apoptosis-defective D3 cells as depicted by D3 AKT cells (purple). W2 (blue), W2 plus AKT (green), D3 and D3 vector controls (red), and W2 plus RAS (yellow) are shown for comparison.
C: H&E staining of W2, W2 AKT, D3, and D3 AKT tumors illustrating tumor giant cells (TGC), necrosis (N), necrotic cells (NC), blood vessels (BV), and healthy tumor (TUMOR). Boxes indicate location of magnified areas.
D: Hypoxyprobe staining (Nelson et al., 2004) of D3 AKT and D3 tumors indicating hypoxic conditions associated with necrotic regions in D3 AKT tumors.
E: H&E staining of W2 BCL-2 tumors and W2 BCL-2 AKT tumors (Nelson et al., 2004) illustrating the pronounced necrosis (N) induced by AKT activation independent of the means of apoptosis inhibition.

