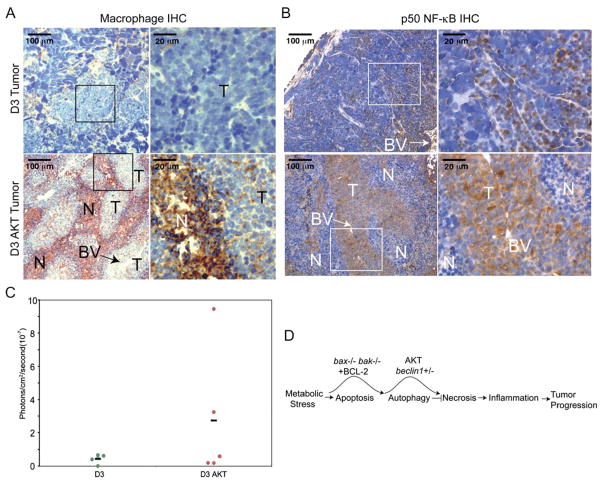
Figure 8. Tumor necrosis is associated with macrophage infiltration and cytokine and chemokine production.
A: The macrophage marker Mac3 staining of D3 (B4) and D3 AKT (D5) tumors by IHC with brown staining indicating reactivity in necrotic areas (100×, insets 400×). Note the high level of reactivity in necrotic areas of D3 AKT tumors and the near absence of staining in D3 tumors.
B: IHC for p50 NF-κB as in A demonstrating enhanced staining in D3 AKT tumors.
C: In vivo tumor necrosis is associated with enhanced activity of the cytokine-responsive IL6 promoter. Tumors were generated subcutaneously by injecting D3 or D3AKT cells stably expressing a luciferase reporter gene under the control of three NF-κB DNA binding motifs from the IL6 promoter and monitored for in vivo promoter activation. To compare the relative luminescence signals in D3 and D3 AKT tumors, the total photon values were normalized to basal luminescence activity at day 2 postinjection and compared to that after tumor growth where tumor sizes were comparable: day 15 for D3 AKT with an average tumor volume of 88.9 mm3, day 29 for D3 with an average tumor volume of 82.2 mm3. The graph represents relative IL6-LUC activity from five individual tumors of each genotype with the mean indicated by the bar.
D: Model for hierarchy of death pathways and impact on tumor growth.

