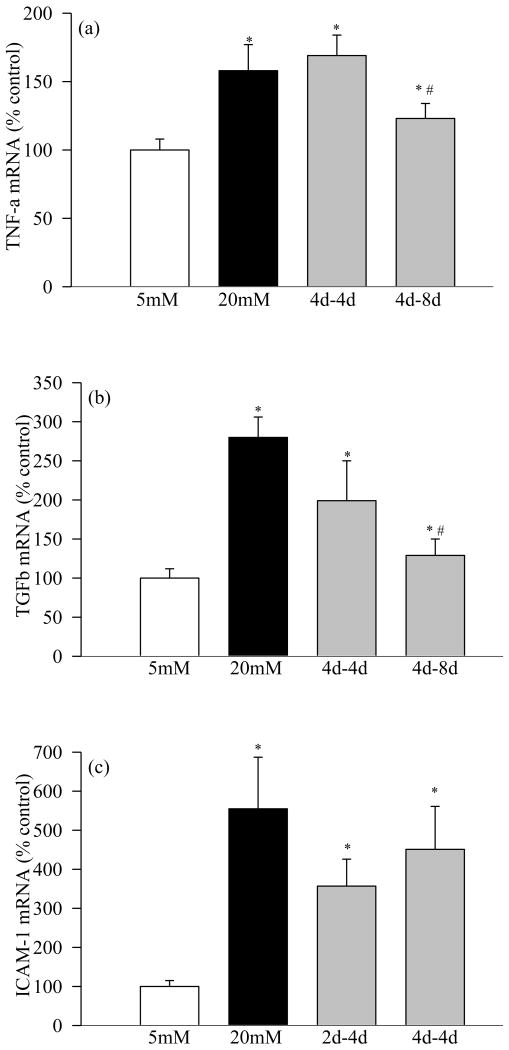
Figure 4.
Effect of variant glucose exposure on gene expressions of (a) TNF-α and (b) TGF-β in retinal pericytes: At the end of the desired incubation, RNA was extracted from pericytes, and the gene expressions of TNF-α, TGF-β and ICAM-1 were quantified by RT-PCR. Each measurement was made in duplicate in the 3 cell preparations. 1=5mM glucose, 2=20mM glucose, 3=2d-4d, 4=4d-8d and 5=4d-4d. In the histogram continuous 5mM glucose is considered as 100%. *P<0.05 compared to continuous 5mM glucose, and #P<0.05 compared to continuous 20mM glucose.

