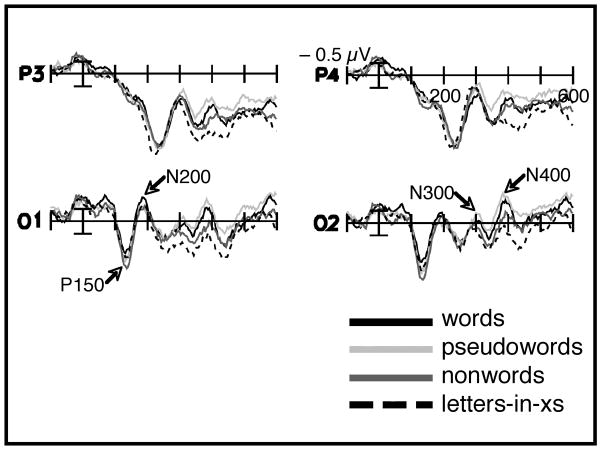
Figure 2.
Grand average ERP waveforms elicited at posterior medial sites by words (solid black line), pseudowords (light gray line), nonwords (dark gray line), and letters-in-xs (dashed line). The P150 and N200 are identified at site O1 and the N300 and N400 are identified at site O2. Each vertical tick marks 100 ms and negative is plotted up. Refer to Figure 6 for full electrode montage. The calibration bar marks 0.5 μV.

