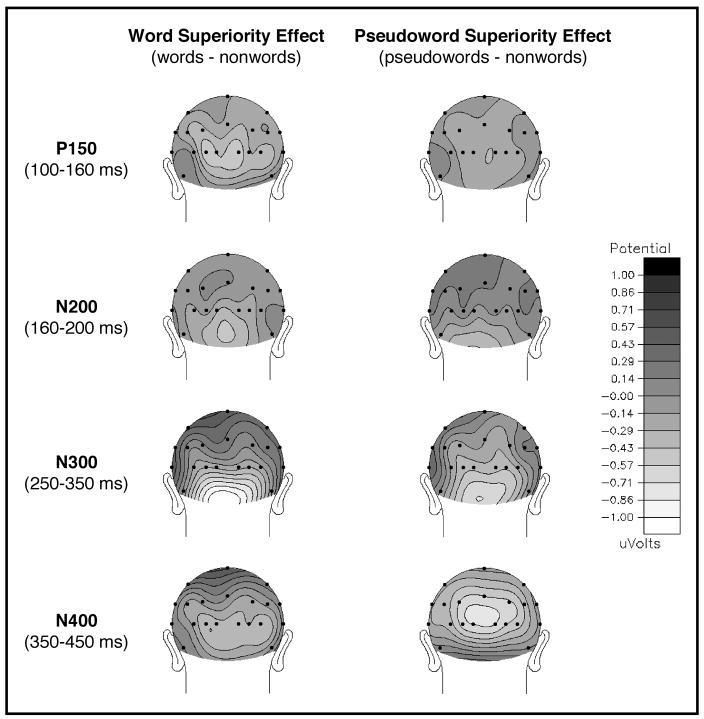
Figure 3.
Topographical voltage maps illustrating the distributions of the word (left column) and pseudoword (right column) superiority effects in each of the four time windows of interest. A spherical spline interpolation (Perrin, Pernier, Bertrand, & Echallier, 1989) was used to interpolate the potential on the surface of an idealized, spherical head based on the mean amplitude voltages measured from the difference waves (ERPs to nonwords subtracted from ERPs to words and pseudowords) at each electrode location within the specified time windows. Peak amplitude measures (reported in the text) revealed word and pseudoword superiority effects (differential processing between words and nonwords or pseudowords and nonwords, respectively) for all components except an N200 pseudoword superiority effect.

