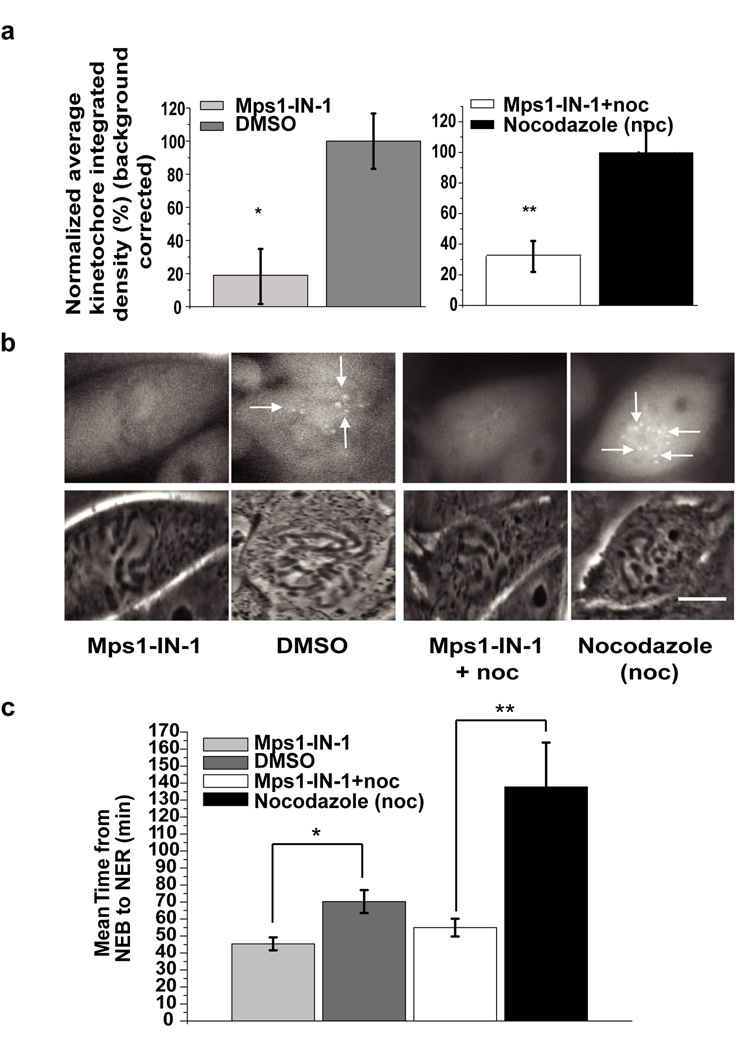
Figure 3. Mps1-IN-1 treatment causes disruption in recruitment of Mad2 to kinetochores.
(a) Establishment of Mad2 at the kinetochores is dependent on Mps1 kinase activity when cells enter mitosis. PtK2 cells stably expressing HsMad2-EYFP were treated with either Mps1-IN-1 (10 µM) (N=29) or Mps1-IN-1 (10µM) and nocodazole (N=25) and then imaged entering mitosis. Corresponding controls were PtK2 cells stably expressing HsMad2-EYFP treated with DMSO (N=26) or treated with nocodazole only (N=20) and then imaged entering mitosis. Normalized average kinetochore density representing Mad2-EYFP at kinetochores was measured and background corrected for each experimental case and control. Error bars represent the 95% confidence interval of each data set (* p-value = 5.63e−09, ** p-value = 7.39−07, Student’s t test). (b) Representative images of PtK2 cells stably expressing HsMad2-EYFP that were treated as in (a). The top panel are images of HsMad2-EYFP fluorescence and the bottom panel are corresponding phase images. Scale bar is equal to 10 µm. (c) Inhibition of Mps1 kinase activity affects mitotic timing. Randomly cycling PtK2 cells stably expressing HsMad2-EYFP were treated with either Mps1-IN-1 (10 µM) (N=29) alone or with Mps1-IN-1 (10 µM) and nocodazole (N=25) and then imaged entering mitosis from nuclear envelope breakdown (NEB) through to nuclear envelope reassembly (NER). Untreated PtK2 cells (N=26) or those treated with nocodazole only (N=20) were also imaged. Average time spent in mitosis (from NEB to NER) is shown. Error bars represent the 95% confidence interval of each data set (* p< 2.23e−08, ** p<3.08−08, Student’s t test).

