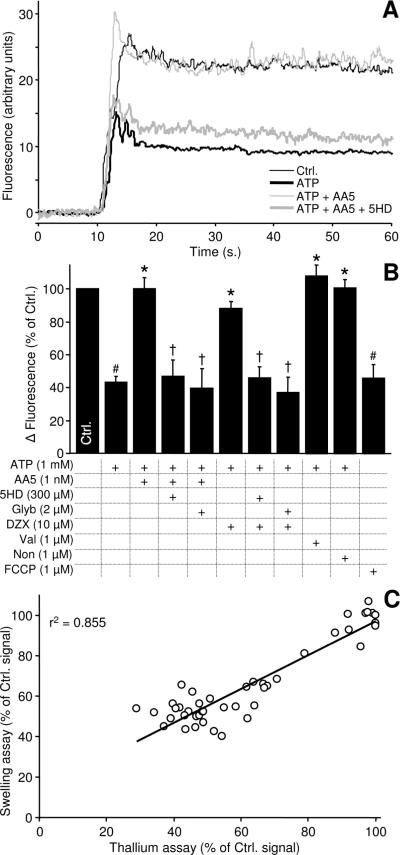
Figure 1. BTC-AM Tl+ fluorescence assay for mKATP activity in isolated heart mitochondria.
(A): Representative traces of BTC-AM Tl+ fluorescence in isolated mitochondria. Fluorescence (λex 488 nm, λem 525 nm) was normalized to the 10 s. of baseline prior to the injection of TlSO4 (arrow). Where indicated, 1 mmol/L ATP (thick, black), 1 nmol/L AA5 plus ATP (thin, grey), or 300 μmol/L 5HD plus AA5 plus ATP (thick grey) were present from the beginning of incubations. (B): Magnitude of the change in BTC-AM fluorescence following Tl+ addition, relative to control. Change in fluorescence was determined by subtracting the average baseline fluorescence from the stabilized average fluorescence at 30–60 s. Delta fluorescence in controls was 26.4 ± 3.3 arbitrary units. Experimental conditions are listed below the x-axis. Data are mean ± SEM, N≥4. # P<0.05 versus control, * P<0.05 versus ATP, † P<0.05 versus the effect of ATP+AA5 or ATP+DZX. (C): Correlation between two assays for mKATP channel activity. Experiments using a variety of conditions that modulate the mKATP were performed using either the osmotic swelling assay and the BTC-AM-Tl+ assay. Both sets of results were expressed as a percent of their respective controls. Linear regression curve fit revealed an r2 of 0.855.

