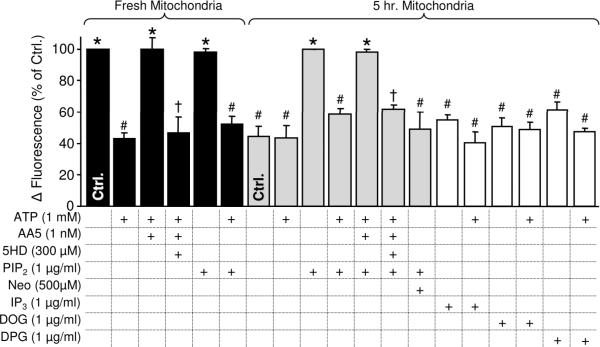
Figure 2. PIP2 modulation of mKATP channel activity using the swelling and BTC-AM-Tl+ assays.
mKATP activity was monitored using the BTC-AM-Tl+ assay in fresh mitochondria (black bars), or mitochondria 5 hrs. post isolation (gray and white bars). Fresh mitochondria data were normalized to control (Δ fluorescence 26.4±3.3) while 5 hr. mitochondria were normalized to control + PIP2 (3rd gray bar, Δ fluorescence 29.3±6.4). Experimental conditions are listed below the x-axis. Data in both panels are means ± SEM, N≥4. Fresh mitochondria: # P<0.05 versus control, * P<0.05 versus ATP, † P<0.05 versus ATP+AA5. 5 hr. mitochondria: # P<0.05 versus control+PIP2, * P<0.05 versus ATP, † P<0.05 versus ATP+AA5, like symbols are not significantly different.

