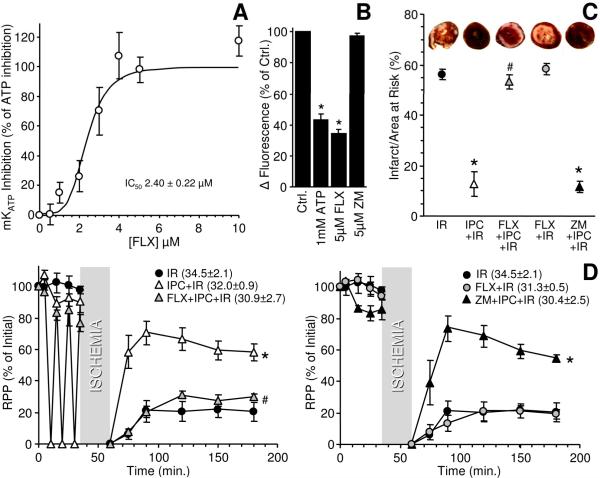
Figure 3. Modulation of mKATP activity and IPC-mediated cardioprotection by fluoxetine.
(A): FLX dose-response of mKATP activity. Activity was measured using the BTC-AM-Tl+ assay. Data were plotted as % mKATP inhibition, with 100% inhibition defined as the condition in the presence of 1 mmol/L ATP, and 0% closed (i.e. open) being the baseline (Ctrl.) condition without ATP. FLX experiments were measured in the absence of ATP. Curve fit using the Hill equation revealed the FLX IC50 to be 2.39 ± 0.22 μmol/L. Data are means ± SEM, N≥4. (B): mKATP activity was measured by the BTC-AM-Tl+ assay. Where indicated, FLX or ZM were present. Data are means ± SEM, N≥4. *P<0.05 versus control. (C): Effect of FLX or ZM on IR injury and IPC. Hearts were subjected to Langendorff perfusion as detailed in the methods. Infarct size / area at risk was quantified from TTC staining, with representative stained hearts shown above each condition. Data are means ± SEM, N≥4, *P<0.05 vs. IR. (D): Rate pressure product (RPP, expressed as % of initial) in hearts subjected to each protocol. Data are split across two panels for clarity (IR data shown in both panels), and are means ± SEM, N≥4. *P<0.05 vs. IR, #P<0.05 vs. IPC+IR. The initial RPP (mmHg·min−1, ×103) for each group is listed in the legend.

