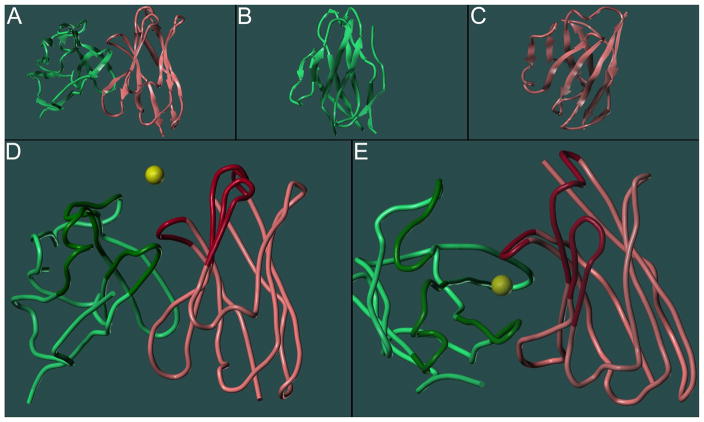
Figure 2.
Model-predicted immunoglobulin fold of the Fv region of mAb 2E2. β-sheets are depicted as arrows and the CDR regions are located on the top (except for E). A: both chains. B: light chain only (green). C: heavy chain only (red). Close-up views of the position of the docking sphere center in relation to the CDRs of the mAb 2E2 model. D: side view. E: top view. The six CDRs are displayed in darker colors and the yellow sphere represents the center of the docking sphere.

