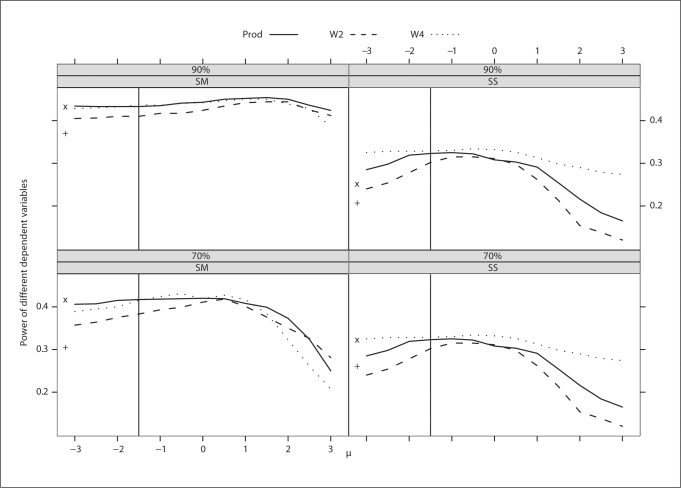
Fig. 3.
Trait with strong familial correlation. Power of different dependent variables for a continuous trait with different levels and schemes of ascertainment. The power of W3 was not plotted because it was the same as that of W4. The abscissa of the vertical line denotes a known population mean of the trait. The ordinates of ‘x’ and ‘+’ denote the power of BLUP-PM and Diff, respectively.

