FIG. 2.
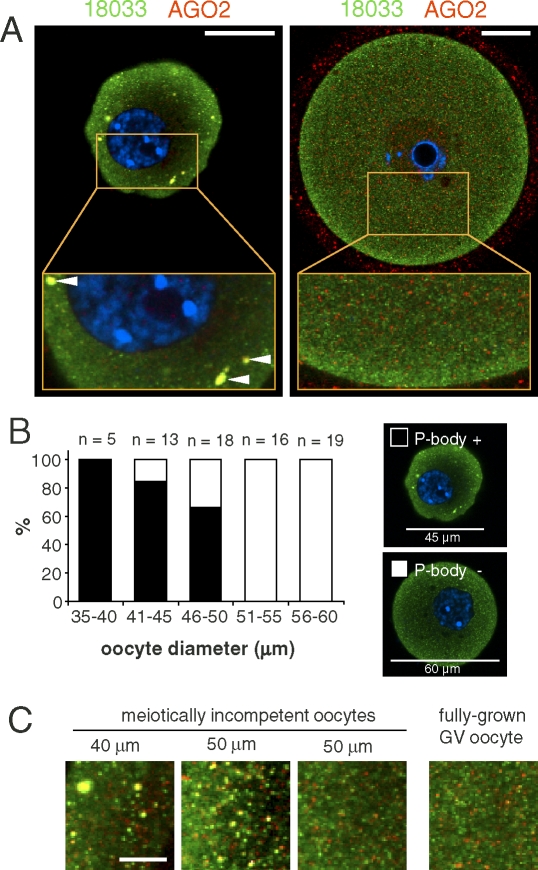
P-bodies disappear as oocytes increase in size. A) Representative confocal images showing colocalization of 18033 and AGO2 in small, meiotically incompetent (12 dpp; left panel) and fully grown GV SN oocytes (right panel). Staining with 18033 is green colored, AGO2 is shown in red, and DNA staining (DAPI) is shown in blue. Colocalization of 18033 and AGO2 yields yellow color. Horizontal arrowheads depict P-body-like structures. AGO2 signal was enhanced in the fully grown GV oocyte to visualize the lack of AGO and 18033 colocalization. It should be noted that the observed intensity of the subcortical staining depends on setting the dynamic range of the image acquisition. Bars = 20 μm. B) Quantification of P-body presence/absence in incompetent oocytes (12 dpp). Oocyte diameter was estimated by image analysis of the central confocal sections. The numbers of incompetent oocytes within each group are indicated above the columns. The representative images show what was classified as a P-body-containing oocyte (shown in the solid bars in the histogram) and an oocyte not containing P-bodies (shown as the open bars in the histogram). These images were acquired in one experiment with the same confocal microscope settings. C) A detail of cytoplasmic staining from incompetent and fully grown oocytes showing the loss of 18033 and AGO2 colocalization in larger oocytes. Staining with 18033 is green colored, and staining with AGO2 is shown in red. Colocalization yields yellow color. Bar = 5 μm.

