Figure 1.
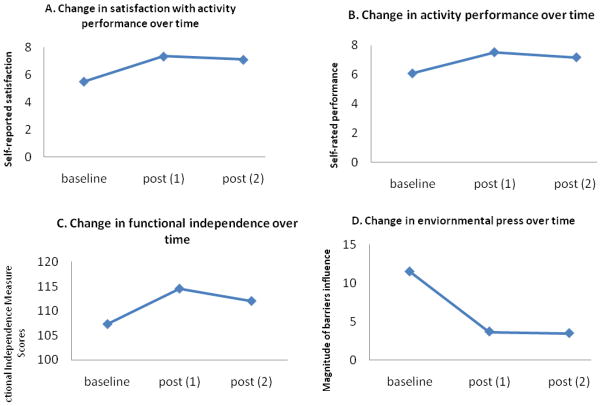
Change in self-rated satisfaction with performance over two years (A). Change in self-rated performance over two years (B). Change in Functional Independence Measure scores over two years (C). Change in environmental press over two years (D).
Note. n=37GLM with contrasts all significant at p<.0001 for baseline to post 1. No significant differences between post 1and post 2 for B, C. A statistically significant decrease was observed from post 1 to post 2 for satisfaction (A) and environmental press (D). Charts A & B represent self-reported performance. Charts C&D represent performance based assessments by occupational therapist.

