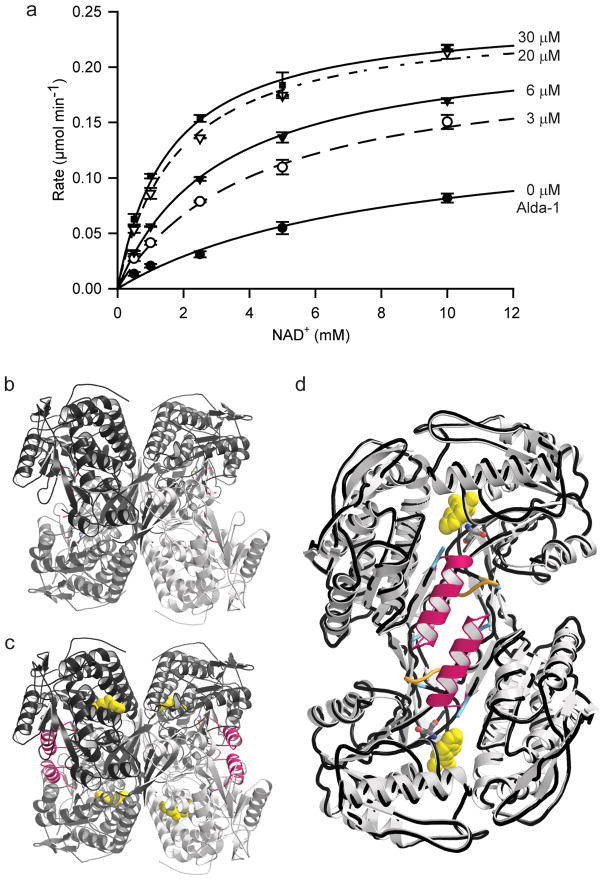
Figure 4. Restoration of Coenzyme-binding properties in ALDH2*2 upon Alda-1 Binding.
(A) Michaelis-Menton plot for the effects of Alda-1 on the dehydrogenase activity of ALDH2*2 against varied NAD+. The plot shows the average values from 3 experiments: Kact = 16 +/− 3 μM; KMNAD = 7.4 +/− 0.7 mM; α-factor = 0.15 +/− 0.03; β-factor = 2.0 +/− 0.2. The concentrations of Alda-1 used in each trace are labeled (0, 3, 6, 20 and 30 μM). The α- and β-factors describe the manner in which Alda-1 impacts the observed KMNAD and Vmax, respectively (See Methods). Thus, Alda-1 restores the KM for NAD+ from 7.4 mM to 1.1 mM and increases the Vmax 2-fold. (B) Ribbon diagram of human ALDH2*2 in the absence Alda-1 (C) Ribbon diagram of human ALDH2*2 in the presence Alda-1. (D) An overlay of a dimer from the ALDH2*2 structures with (light grey ribbons) and without Alda-1 (black worm tracing). For panels (C) and (D), the positions of the Alda-1 molecules are indicated using yellow space-filling representations and the positions of the now ordered αG helices in each subunit are highlighted with pink coloring. Panels B, C and D were produced using PyMol for Windows25.

