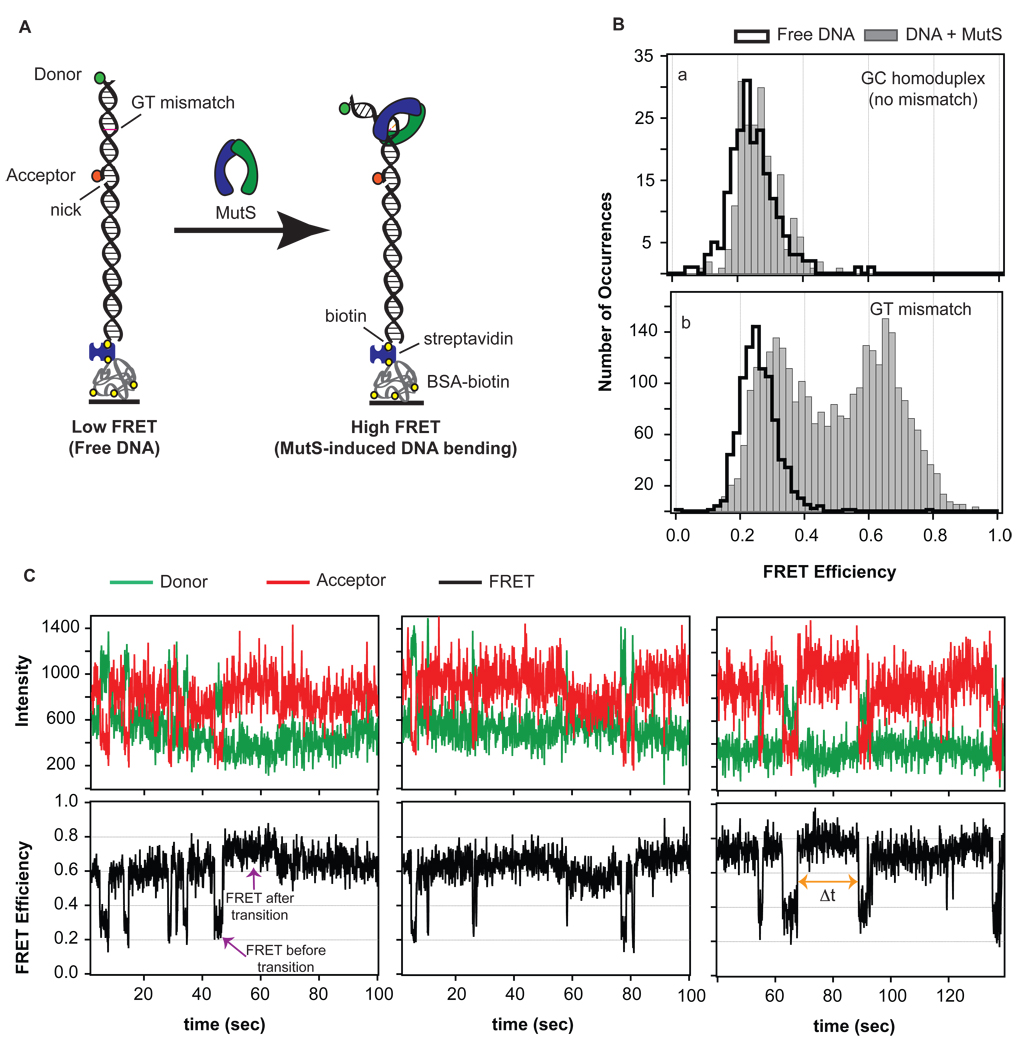
Figure 1.
(A) FRET reporter to measure MutS-induced DNA bending. A FRET donor and FRET acceptor are tethered to a 50 base-pair strand of DNA. The fluorescent dyes are located 19 base pairs apart with the GT-mismatch located about halfway between the two dyes. Upon MutS-induced DNA bending at the mismatch, the separation between the dyes decreases, and an increased FRET signal is observed. (B) FRET efficiency distribution of states in the absence (black cityscape) and presence (solid gray bars) of MutS for two DNA substrates: one without a mismatch (GC homoduplex, a) and one containing a mismatch (GT mismatch, b). The shift in the FRET distribution for MutS bound to a GT mismatch reveals mismatch-specific DNA bending induced by the protein. (C) Sample FRET donor, FRET acceptor, and corresponding FRET efficiency traces for GT mismatched DNA in the presence of MutS. Molecules sample a number of different FRET states, or bend angles, ranging from unbent (low FRET) to bent (high FRET) with very different kinetic rates of exchange among these states.

