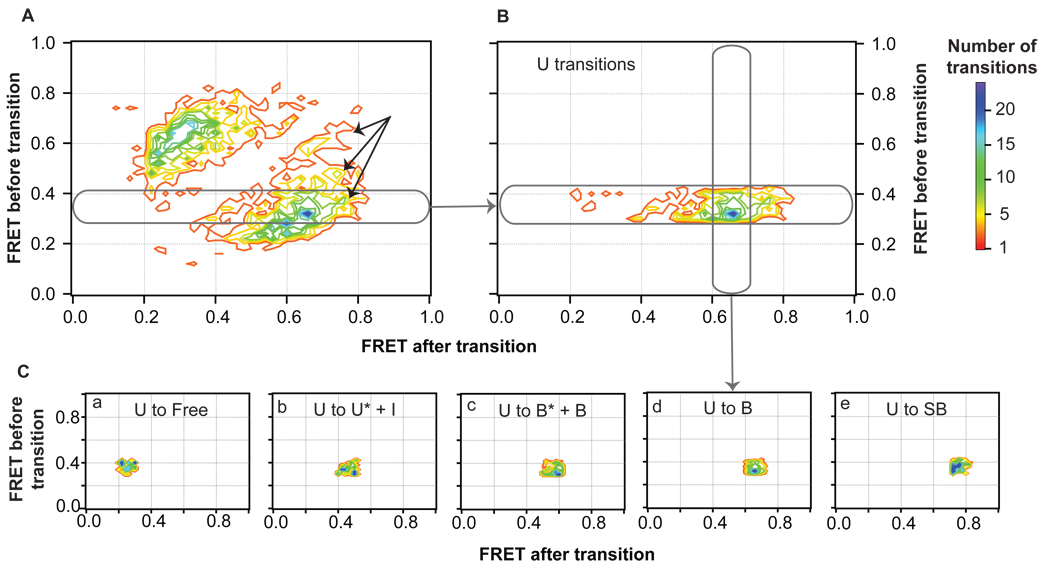
Figure 4.
Separation of transition peaks in the TDP by FRET efficiencies. (A) Contour image of the transition density distribution shown in Figure 2A. Black arrows represent transitions to a high FRET state not isolated by lifetime examination (conformation SB). (B) Transition density distribution for a section of transitions from an individual state (U). Individual peaks are cross-sectioned (C) and fit to 2D Gaussian distribution distributions. Complete documentation on this analysis across the entire TDP is shown in Figure S4.

