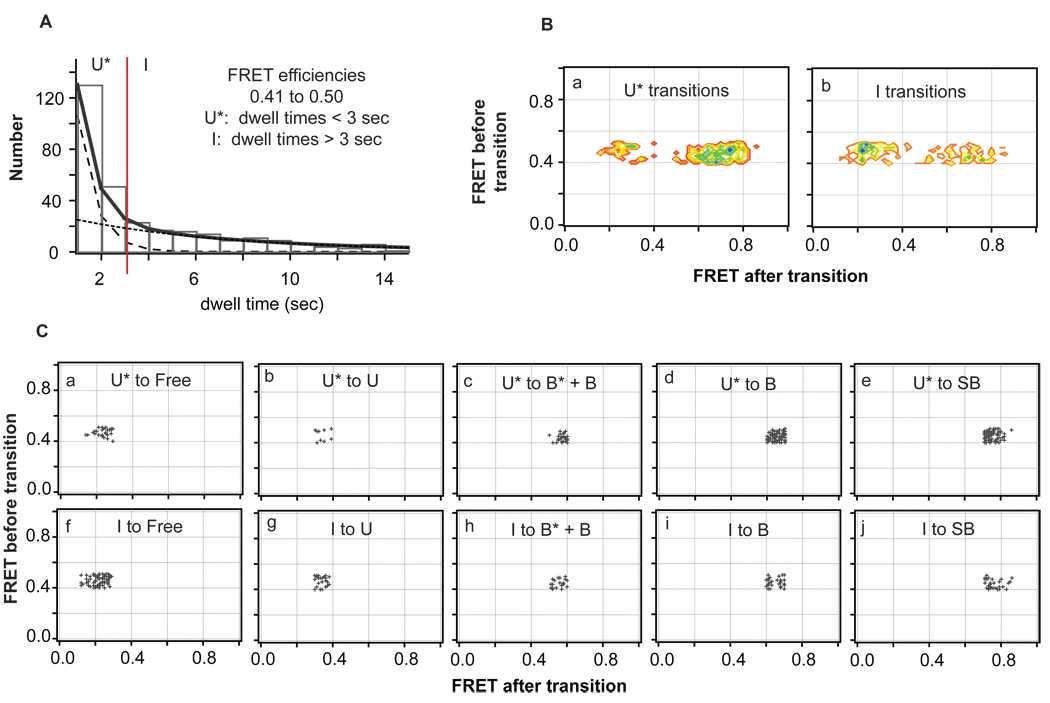
Figure 5.
Separation of transition peaks for states with overlapping FRET ranges by lifetimes. (A) Dwell time distribution of a FRET efficiency state (0.41 to 0.50) comprised of two species (U* and I) determined from lifetime analysis (Figure 3D). The double exponential decay fit (solid black line) is deconvoluted into two single exponential decay fits (dashed black lines), and the two species are separated by dwell time (red line). (B) Transition density distributions for transitions identified when the two species in the mixed FRET state are separated by dwell time. (C) Scatter plots showing the transitions for the cross-section of each transition. The transition sequences of each species are not affected by altering the cutoff time (red line, A) between the two states to +/− 1 second.

