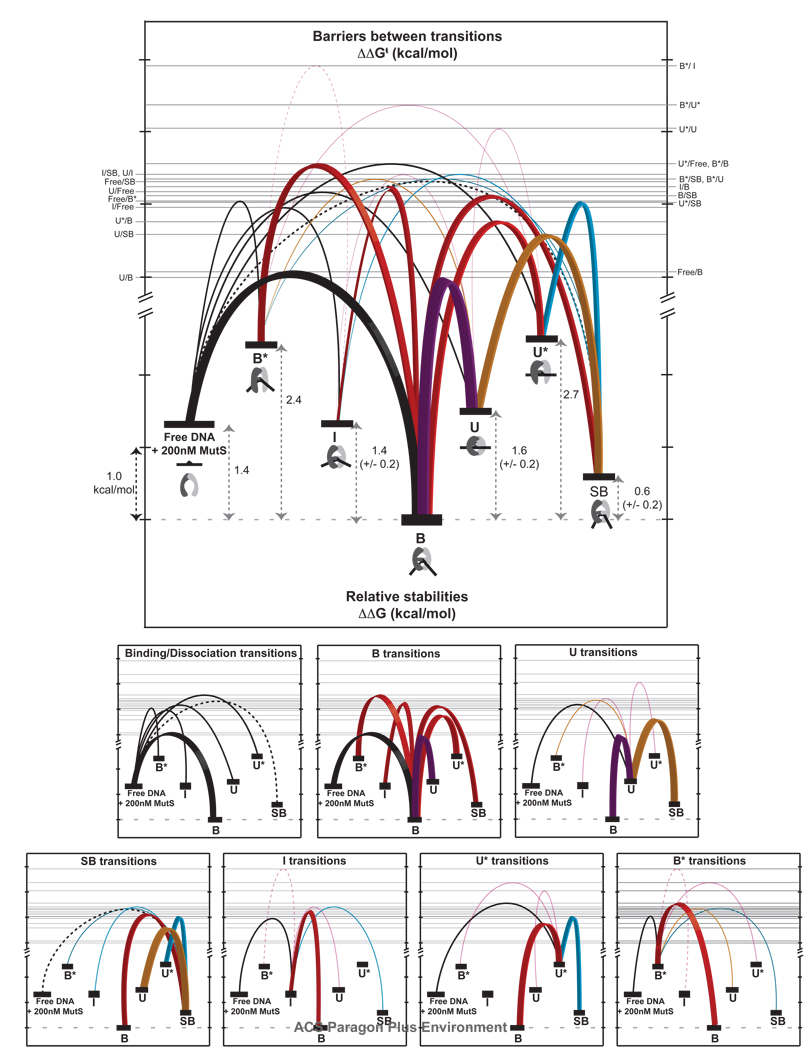
Figure 7.
Free energy diagram showing the relative stabilities (ΔΔG°) of each state and the relative free energy barriers (ΔΔG†) for each GT-MutS conformational, binding, and unbinding transition. The top diagram shows all transitions and the bottom diagrams show the transitions for each state. Tick marks represent ~ 1 kcal/mol. Binding and dissociation transitions are shown in black. Transitions down the energy funnel to the stable bent state B are shown in red with bold lines, with the most frequently observed transition (U↔B) shown in purple. The other dominant transitions in the kinetic scheme (U↔SB and U*↔SB) are shown with bold lines for emphasis. Transitions to state SB are shown in cyan; transitions to U are shown in orange. The error in the relative free energies of conformations UI, and SB result from differences in free energy calculations from different pathways. All other states yield the same free energy independent of path. All of the relative free energy barriers, with the exception of Free↔SBU↔IB*↔U*, and B*↔I, have an absolute variation from the average of the forward and reverse transitions of less than ± 0.1 kcal/mol. Transitions between Free↔SB (dashed black line), U↔I and B*↔U* (solid magenta lines) have an error of ± 0.2 kcal/mol, and the transition between B*↔I (dashed magenta line), which shows the fewest transitions, contains the largest error (± 0.6 kcal/mol). For simplicity, the relative free energies were calculated for a specific concentration of MutS (200 nM). However, addition of the concentration factor only changes the absolute free energy of the ‘Free DNA + MutS’ state and does not impose a difference in the relative free energies of the other conformations. For example, reducing the MutS concentration from 200 nM to 20 nM stabilizes the ‘Free DNA + MutS’ state by 1.4 kcal/mol (from ΔΔG = 1.4 kcal/mol to ΔΔG = 0 kcal/mol with respect to conformation B).

