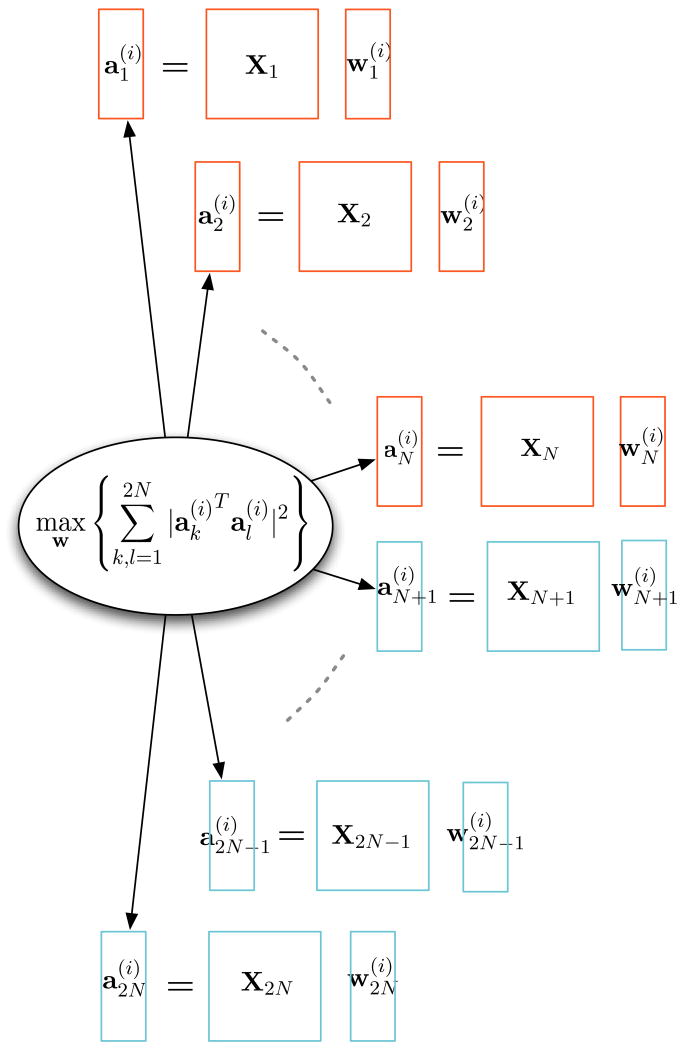
Fig. 2.
Stage i of the M-CCA iterative procedure. M-CCA maximizes the sum of squared correlations of the trial-to-trial variations across the two modalities across N subjects. X1 : XN represents the fMRI datasets and XN+1: X2N represents the EEG datasets. The rectangle represent column vectors and the squares represent matrices.

