
Fig. 4.
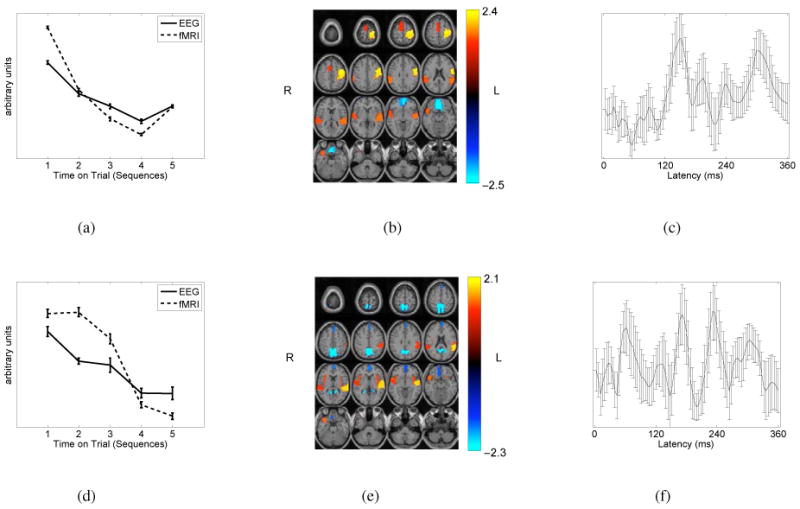
For component 1: (a) Average trial-to-trial variations for the first 5 sequences and standard error bars for fMRI and EEG, (b) thresholded average fMRI map (Z = 1.5) showing high activation in pre-and postcentral gyrus (yellow) along with slightly lower activation in supplementary motor area, supra-marginal gyrus, and the superior temporal gyri and pole (orange) and deactivation in superior orbito-frontal cortex, medial orbito-frontal cortex, and rectus gyri (cyan/blue), and (c) the squared average of the EEG component. For component 2: (d) Average trial-to-trial variations for the first 5 sequences and standard error bars for fMRI and EEG, (e) thresholded average fMRI map (Z = 1.5) showing high activation in superior temporal gyrus (yellow) with slightly lower activation in insula, supra-marginal gyrus, and the superior temporal gyri and pole (orange) and high deactivation in precuneus (cyan) along with slightly lower deactivation in medial frontal gyrus, orbito-frontal gyrus, and rectus (blue) and (f) the squared average of the EEG component.