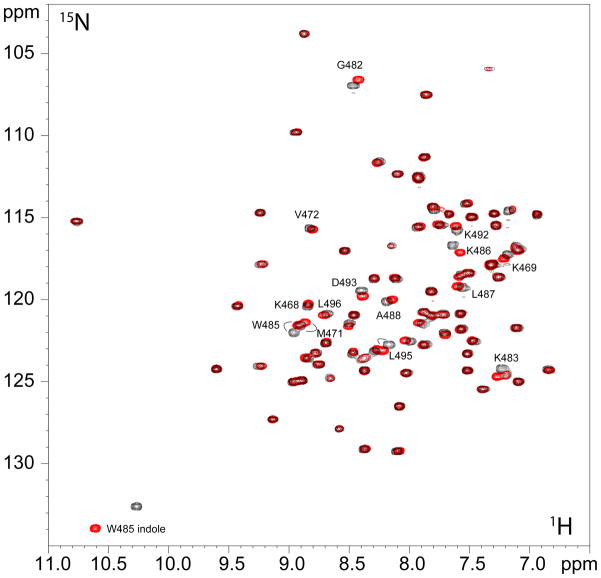
Figure 2.
1H/15N HSQC spectrum of 15N-labeled EHD1 EH in the presence of saturating amounts of Rsn5-NPF1 (black) or Rfp2-NPF2 (red) showing the almost identical chemical shift changes for the two peptides. The protein was 2.5 mM and the peptides were 3 mM and 7.5 mM respectively. Selected residues that shift upon addition of peptide are labeled.

