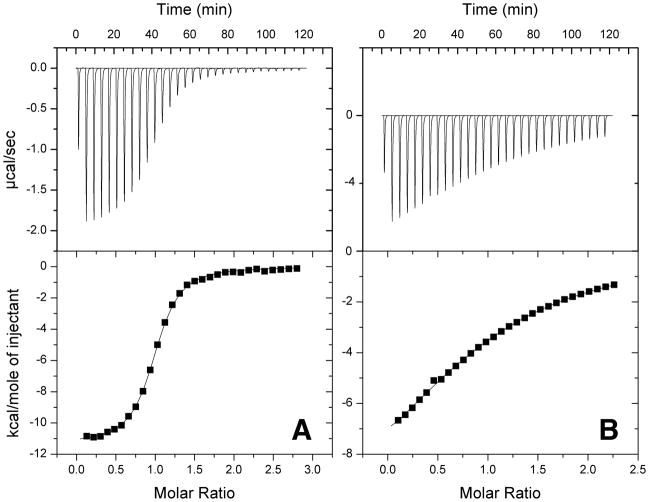
Figure 3.
(A) Typical ITC dataset for Rsn5-NPF1 binding to EHD1 EH. The protein in the calorimeter cell was 50 μM and the peptide titrant was 0.5 mM. (B) Typical ITC dataset for Rfp2-NPF2 binding to EHD1 EH. The protein was 200 μM and the peptide 2 mM. Both experiments were carried out in 25 mM MOPS, 1 mM CaCl2 at 20°C.

