Figure 1.
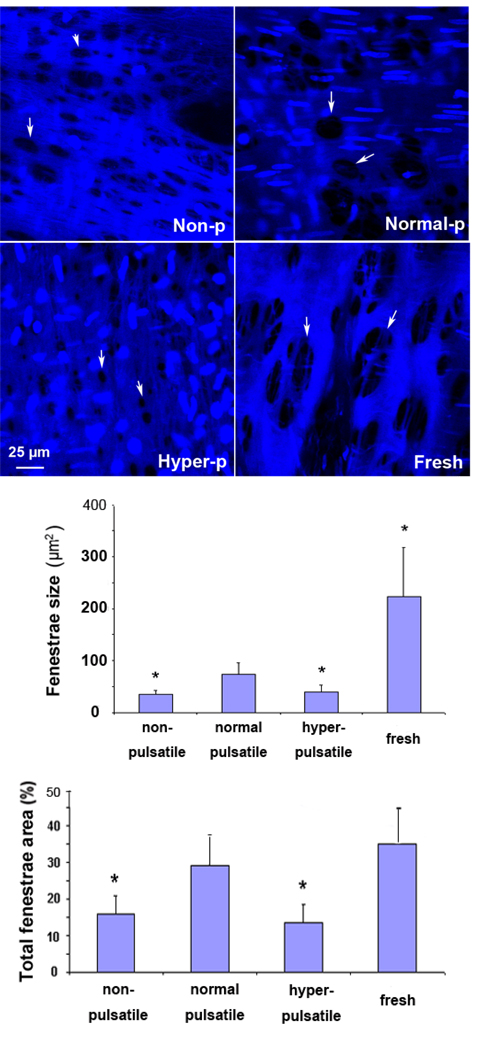
Top: Confocal microscope images of fenestrae (marked by arrows) in the IEL of porcine carotid arteries cultured under nonpulsatile pressure (non-p), normal pulsatile pressure (normal-p), and hyperpulsatile pressure (hyper-p) for 7 days as compared to a fresh artery. Middle & Bottom: Comparison of the average fenestrae size and the total fenestrae area ratio in arteries cultured under different pulse pressure. Data were plotted as means± SD. *p<0.05. Sample size n=3.

