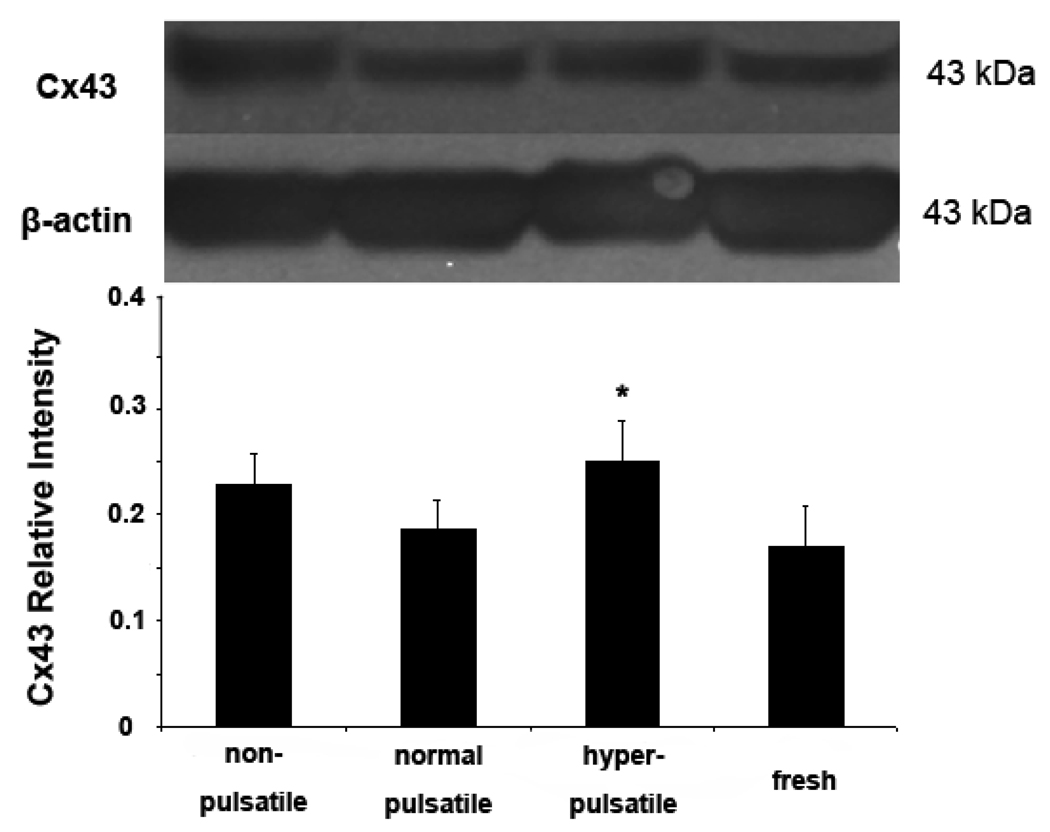
Figure 5.
Comparison of connexin 43 and β-actin expression in arteries cultured for 7 days under nonpulsatile, pulsatile, and hyperpulsatile pressure conditions and in fresh arteries. The top panel shows a typical blotting image and the bottom panel summarizes densitometric measurements (mean ± SD) *p<0.05. Sample size n=4.

