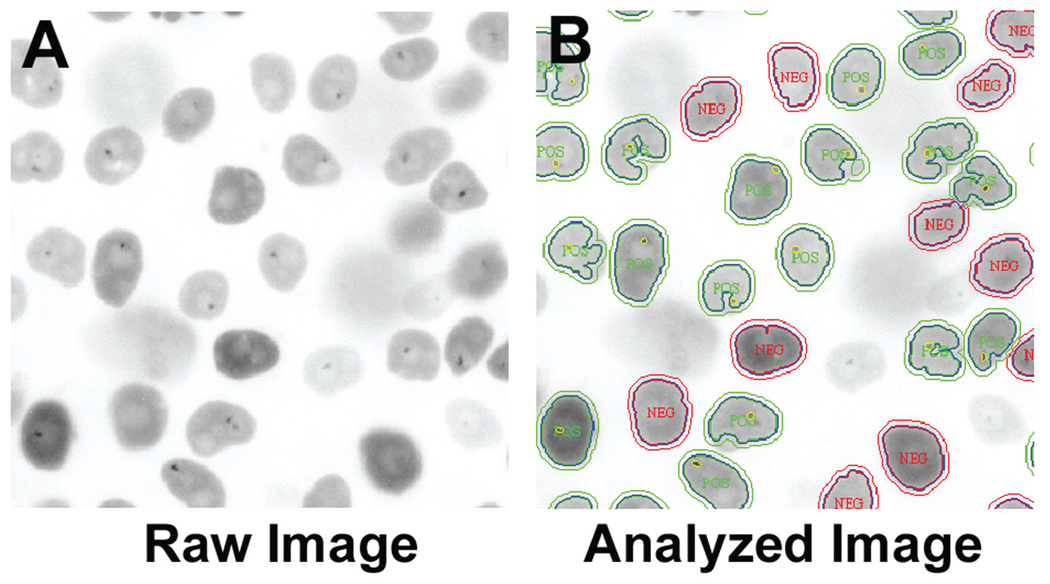
FIG. 2.
(A) Inverted gray-scale image of polypyrimidine binding tract protein–green fluorescent protein (PTB-GFP) PC-3M cells, treated with 0.5% DMSO and imaged with a 20× objective, GFP filter, and 100 ms exposure. Dark dots in the nucleus are perinucleolar compartments (PNCs). (B) Raw image with the superimposed postprocessing masks created by the IN Cell Analyzer 1000 Workstation MTA algorithm. POS, cells with PNCs; NEG, cells without PNCs as determined by the algorithm. Only a portion of the entire field of view captured is displayed.

