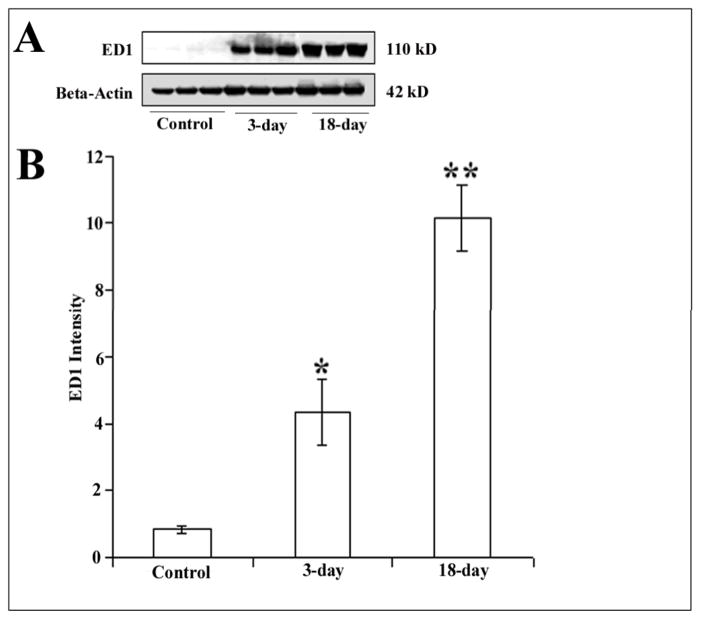
Figure 8. gp120 increases ED1 immunoreactivity.
Rats were injected into the superior colliculus with heat-inactivated gp120 or gp120. 3 or 18 days later, rats were euthanized and their visual cortex was dissected. Cortical lysates were prepared for Western blot analysis of ED1 immunoreactivity as described in Methods. A. Representative Western blot analysis of ED1 immunoreactivity in the visual cortex of control and gp120-treated rats (3 and 18 days post-treatment). Beta-Actin was used to control for protein loading. B. Immunoreactive bands were quantified by Quantity One 1-D Analysis Software. Data, expressed as intensity of immunoreactive bands, are the mean ± SEM of six independent samples per group. *p<0.05, **p<0.01 vs control.

